Three weeks after launch, the support lead pulls up the dashboard for the AI agent handling ticket triage: uptime 99.9%, average latency 340ms, error rate under 0.1%. Every chart is green. Then a customer forwards an email where the agent confidently routed a billing dispute to the shipping team and told them it was resolved. Nobody got paged, because nothing crashed. The agent responded on time, in valid JSON, with a plausible-sounding answer, it was just the wrong one, and that is precisely the failure mode that infrastructure monitoring was never built to catch.
What makes an AI agent failure 'silent'
A silent failure is when an agent returns a successful response, a 200 status, normal latency, well-formed output, that is actually wrong: a hallucinated fact, a mis-routed action, a step skipped, or a decision made on stale context. It trips no conventional alert because the service genuinely did respond, so uptime monitors, latency dashboards and error-rate alerts all report a healthy system while the agent is quietly getting the task wrong.
This is structurally different from a normal software failure. A broken API call throws an exception you can catch. A hallucinated citation or a wrong tool call doesn't throw anything, it looks exactly like a correct response until a human notices the downstream damage, which is usually days later and after several more identical mistakes have already shipped.
Why uptime, latency and error rate don't catch this
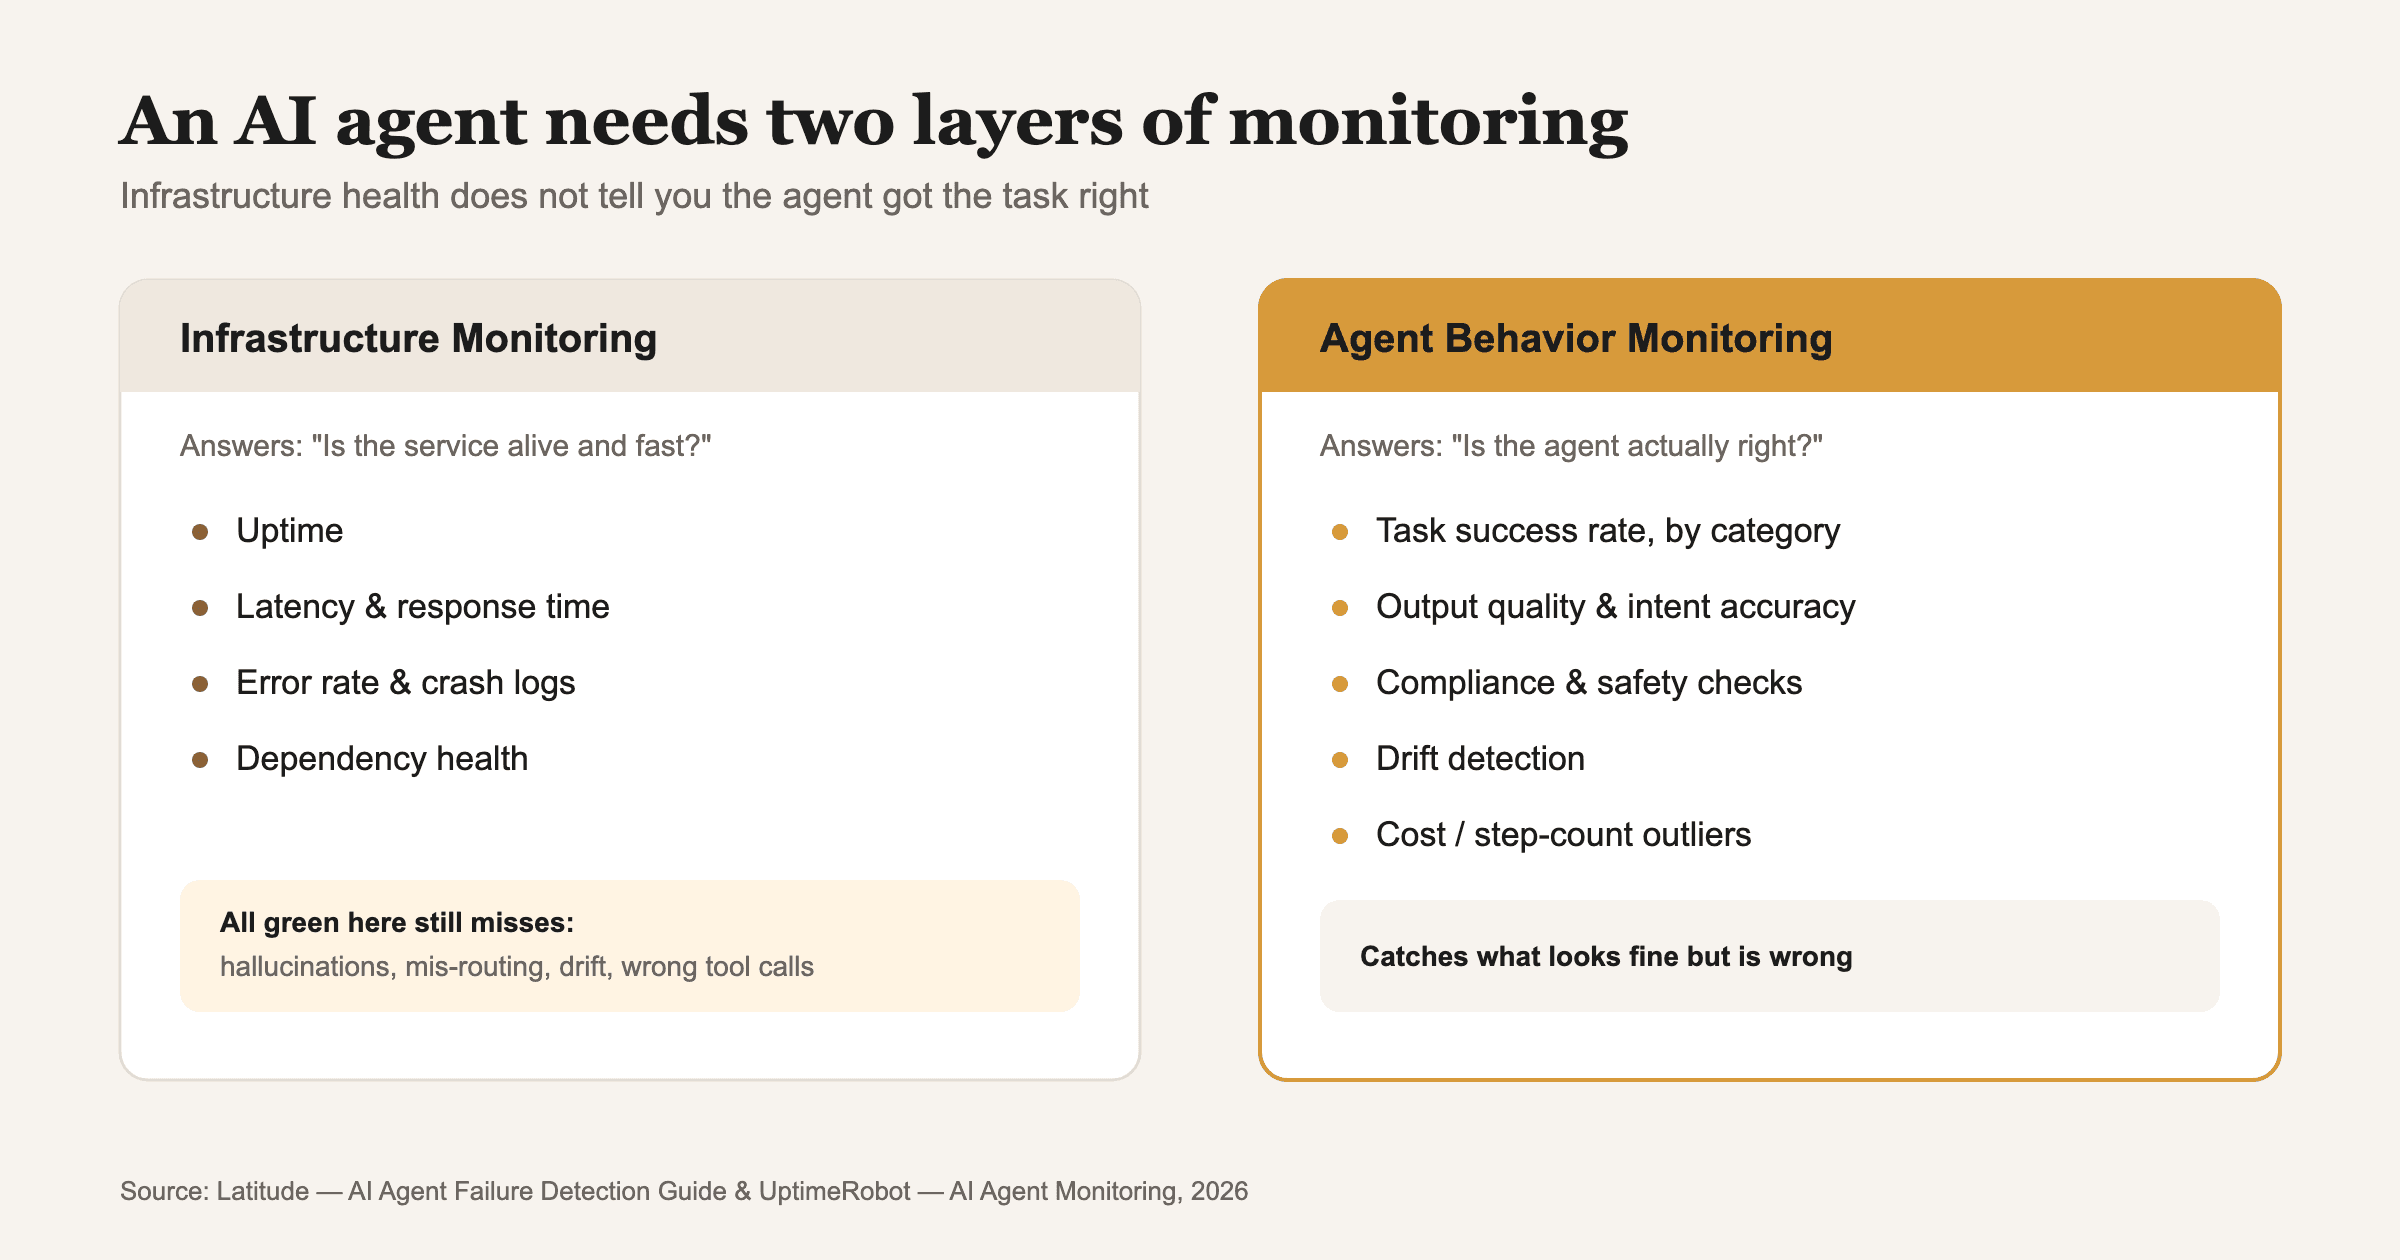
Traditional monitoring answers 'is the service alive and fast', which is necessary but insufficient for an AI agent, because agents fail by succeeding at the wrong thing, not by crashing. Latitude's framework for detecting AI agent failure modes in production makes the case that agent failures require different observability than standard systems: they involve multi-step causal chains rather than a single request-response pair, so a failure two steps into a five-step workflow can look completely healthy in every individual system log while producing a wrong final outcome.
The practical implication is that you need a second monitoring layer sitting on top of your infrastructure metrics, one that scores the correctness and quality of what the agent actually did, not just whether it responded.
The metrics that actually catch agent-behavior failures
- Prompt / task success rate: how often the agent produces a usable, correct result for a given class of request, tracked per task type, not as one blended number, since a 95% blended success rate can hide a task category failing 40% of the time.
- Output quality and intent accuracy: whether the agent understood the request and produced a complete, correct answer, typically scored by a secondary evaluation pass (an LLM-as-judge or a rules-based checker) rather than assumed from the response looking fluent.
- Compliance and safety checks: automated checks that flag responses violating policy, brand voice, or regulatory boundaries before they reach a customer, catching the class of failure that looks fine on the surface but is legally or reputationally costly.
- Drift detection: tracking whether the agent's behavior on a fixed set of test cases changes over time, which catches silent degradation after a model update, a prompt change, or a shift in the data the agent is retrieving from.
- Cost and step-count outliers: a sudden jump in tokens used or steps taken per task is often the earliest signal of a retry loop or a reasoning failure, long before it shows up as a customer complaint.
Diagnosing failures once you've caught one
Catching a silent failure is only half the problem, the other half is figuring out which of the multiple steps in the agent's chain actually went wrong. UptimeRobot's guide to AI agent monitoring recommends tracking system health (availability, latency, dependencies) and agent behavior (accuracy, drift, cost) as two separate but connected layers, because a behavior failure with healthy infrastructure points at the prompt, the retrieved context, or the tool call logic, not the servers.
That diagnosis depends on full trace collection: logging every intermediate step, tool call, and piece of retrieved context the agent used to reach its final answer, so when quality drops you can replay the exact chain and find which link broke instead of guessing. This is the same discipline covered in our breakdown of why AI agents choose the wrong tool and why AI agents hallucinate, both of which are silent-failure patterns that only surface with trace-level visibility.
Two layers of monitoring, side by side
Building this second layer doesn't require replacing your existing observability stack, it means adding an evaluation pass that runs on a sample of production traffic (or all of it, for high-stakes flows), scoring correctness against defined pass/fail criteria before a response ships, and alerting on quality-score drift the same way you'd alert on latency. Teams that skip straight from evaluating an agent before production to trusting green dashboards forever are the ones who find out about a silent failure from a customer instead of a monitor.
How AIBOOTSTRAPPER helps
AIBOOTSTRAPPER built exactly this two-layer discipline into AI Doctor, a symptom-triage assistant now running 24/7 for a Dubai clinic in Arabic and English. The system needed clinically guarded safety guardrails and a handoff workflow that escalates to a human doctor with a complete, correct pre-filled summary, a use case with zero tolerance for a silent failure slipping through as a confident-sounding wrong triage. The result: 68% faster consultation prep with an escalation path built to catch what automated checks miss, not just an agent that responds fast.
If your agent's dashboard is all green and you still don't fully trust its output, that gap is usually a missing evaluation layer, not a model problem. Book a call and we'll walk through what a behavior-monitoring layer would look like for your specific workflow.
Want this done for you?
Book a free strategy call and we'll show you how to build and market your business with AI.